
The Chart Points DataSheet provides a list of data for each calculated chart point that is enabled in your settings.

Select this icon from the toolbar to view the Chart Points DataSheet for the current chart.
This list displays the following data for each chart point:
- Name & category of chart point
- House position
- Zodiac sign & position (ecliptic longitude)
- Declination (equatorial declination)
- Quality of Cardinal, Fixed or Mutable based on the sign
- Element of Fire, Earth, Air or Water based on the sign
- Velocity/speed of the chart point
Uniwheel Charts
When looking at a single chart of any type, you’ll see a screen like the one below which shows you all chart points in planetary order that you have enabled.
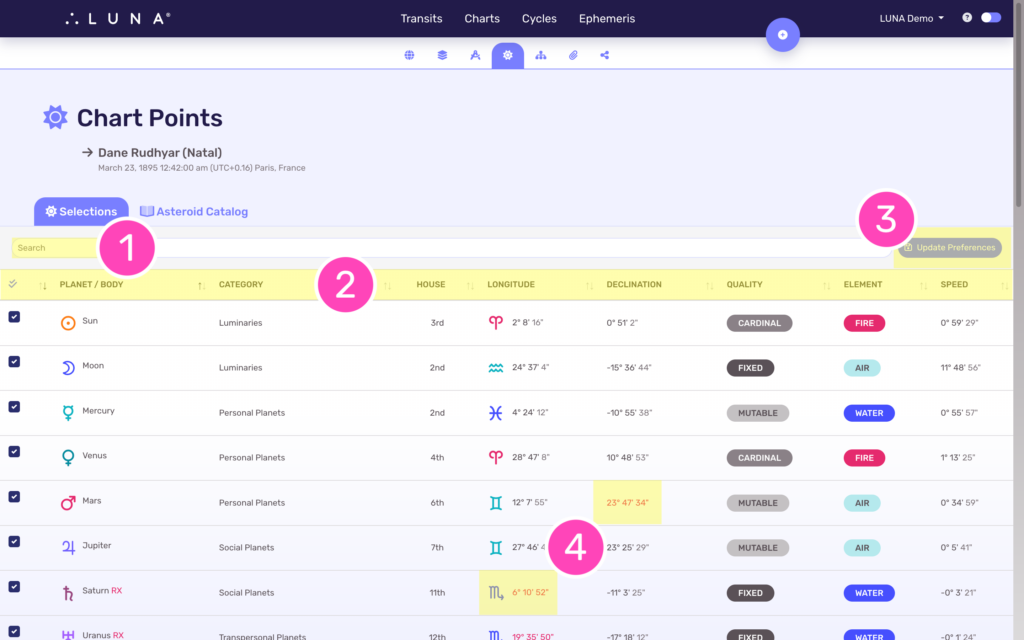
1. Search Chart Points
This list is searchable which means you can enter any keyword into the search box and only the matching results will show. For example, if you enter “cardinal” as a search term, only chart points in cardinal signs will display.
2. Sort Chart Points
Another way to look through this list of chart points is by sorting them by any of the column headers. Notice there is a double arrow icon to the right of each column header. This icon can be clicked or tapped to sort the list by that factor. Select the icon again to sort the list in reverse order.
3. Show & Hide Chart Points
This DataSheet allows you to make changes to your settings by turning on and off any of the available chart points. Chart points you have selected will have a checkmark next to them and display first in the list. The other available chart points show below with an empty checkbox and no data associated with them, because they are not calculated until you select them.
To do this, select the chart points you want calculated and then click or tap the “Update Preferences” button.
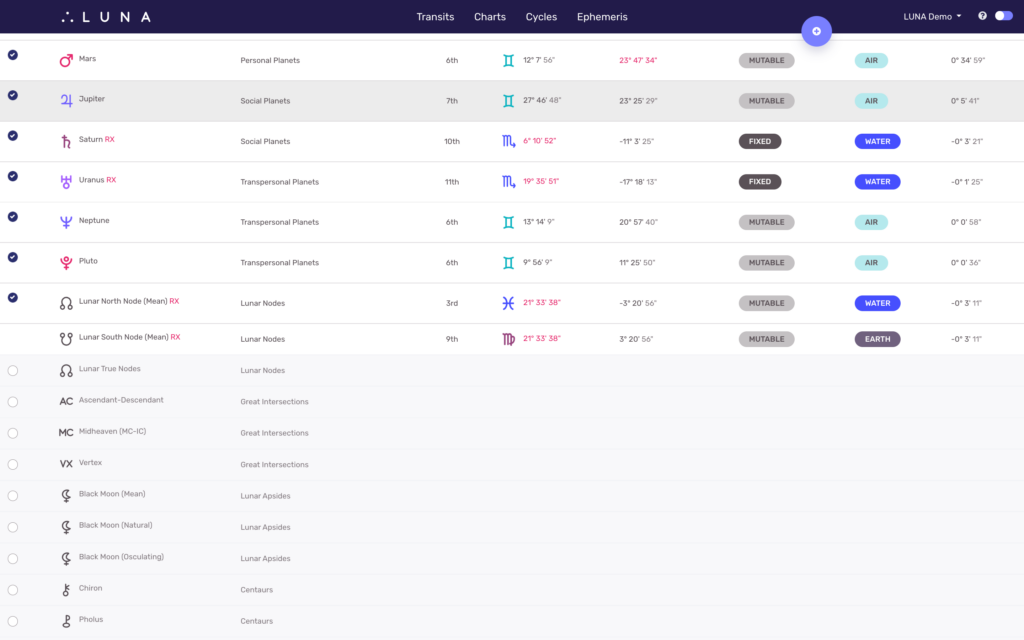
Notice how non-selected chart points show at the bottom of the Chart Points DataSheet and do not have any data calculated for them.
4. Retrogrades & Out of Bounds (OOB) Chart Points
When a chart point is in retrograde motion (moving backwards in the zodiac), LUNA displays its zodiacal value in red to indicate this. When a chart point is out-of-bounds (OOB) in declination, LUNA displays its declination value in red to indicate this.
Biwheel Charts
When viewing a biwheel between any two (2) charts, the Chart Points DataSheet lets you select the chart for which you want to view chart points.
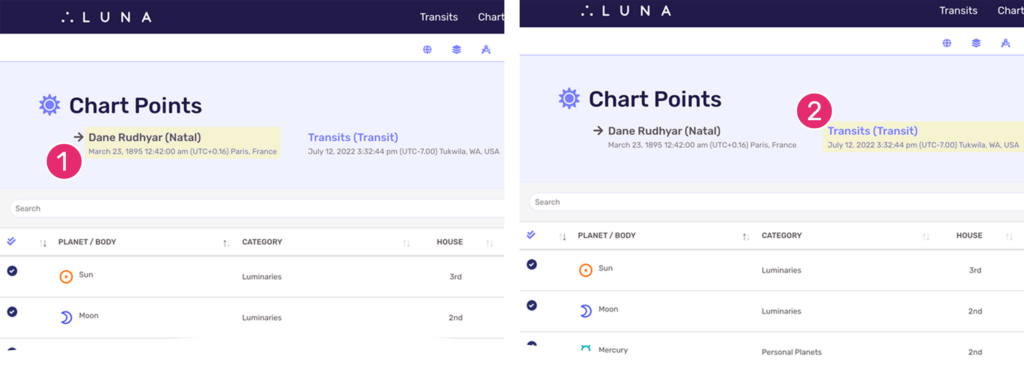
1. Chart Points for Inner Chart Wheel
The screen on the left is showing the chart points for Dane Rudhyar. You can see this because there is an arrow pointing to his name. Additionally, the other chart title in the layout is clickable/tappable, whereas his is not.
2. Chart Points for Outer Chart Wheel
The screen on the right is showing the chart points for the transits. You can see this because there is an arrow pointing to that chart’s title. Additionally, Dane Rudhyar’s chart title is clickable/tappable, whereas the transit chart is not.